ABAP Debugger
ABAP Debugger Capability
Adri AI agents can use the SAP debugger workflow, including:
- setting breakpoints
- launching a debug run in the selected SAP system
- stepping through execution (step over/step into/continue)
- collecting runtime findings from actual execution paths
This is very useful for hard-to-trace behavior, exits, and BAdI resolution. Adri AI now supports the full debugger capability set for day-to-day ABAP debugging workflows.
Pre-requisites
- Complete MCP setup in Claude Code: Setup (Claude Code)
- Make sure your target SAP system is connected.
In these screenshots, the red box shows user action and the blue box shows important information to note.
Step-by-step (Claude Code example)
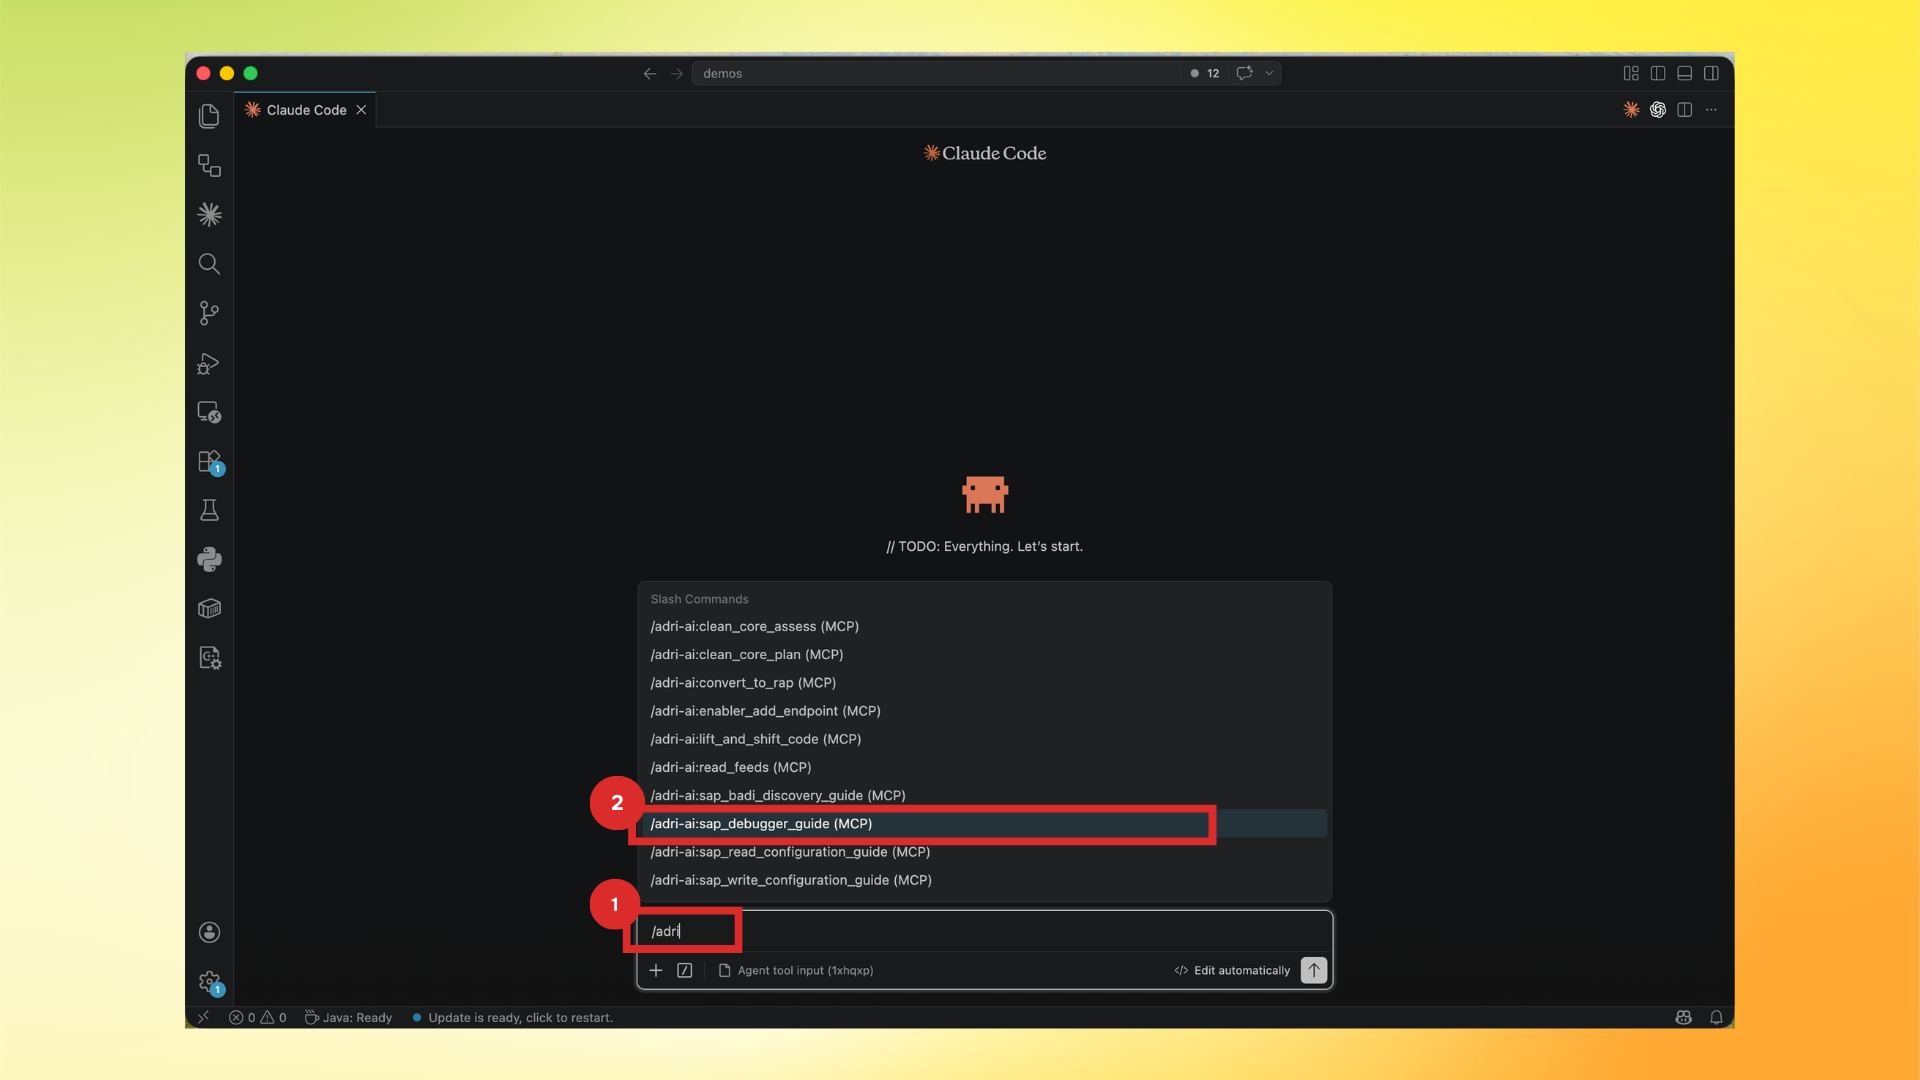
- In Claude Code, type
/adriand select/adri-ai:sap_debugger_guide (MCP).
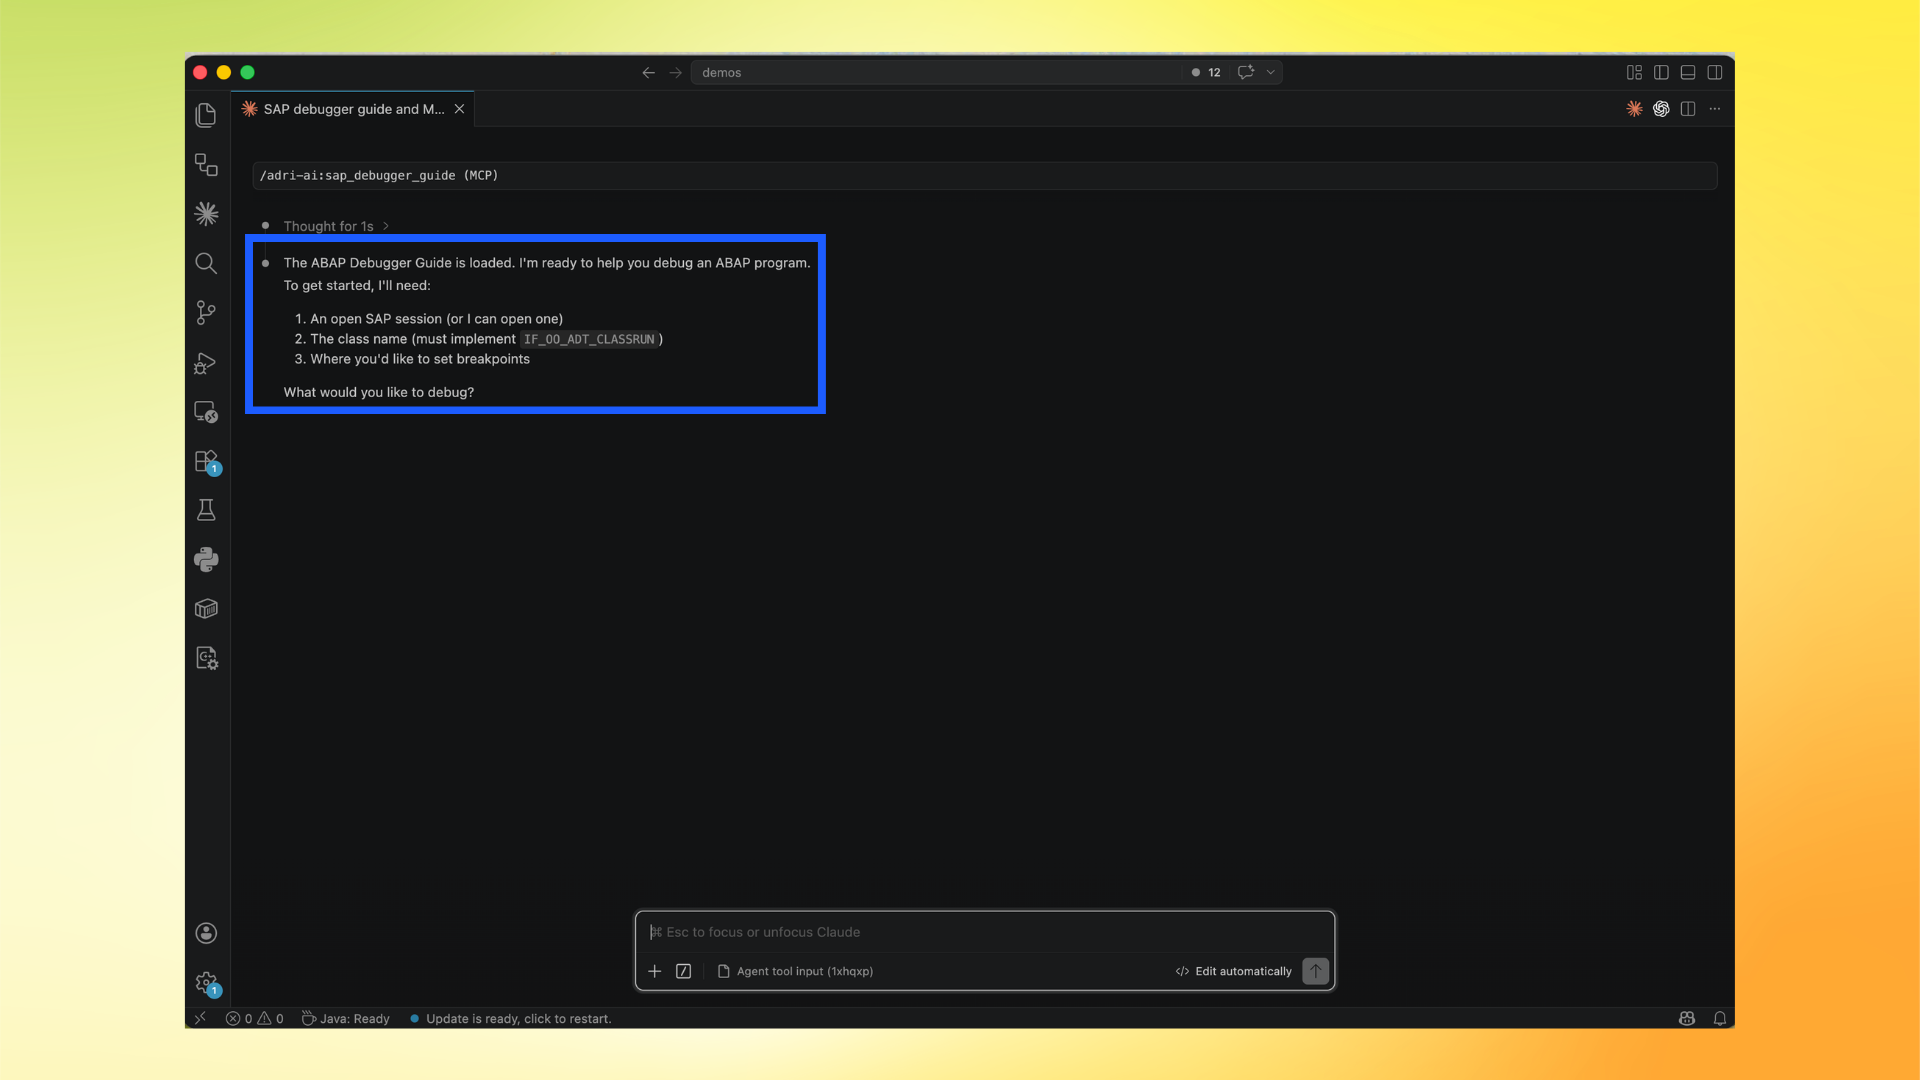
- Confirm the debugger guide is loaded. It asks for the SAP session/program context and where to place breakpoints.
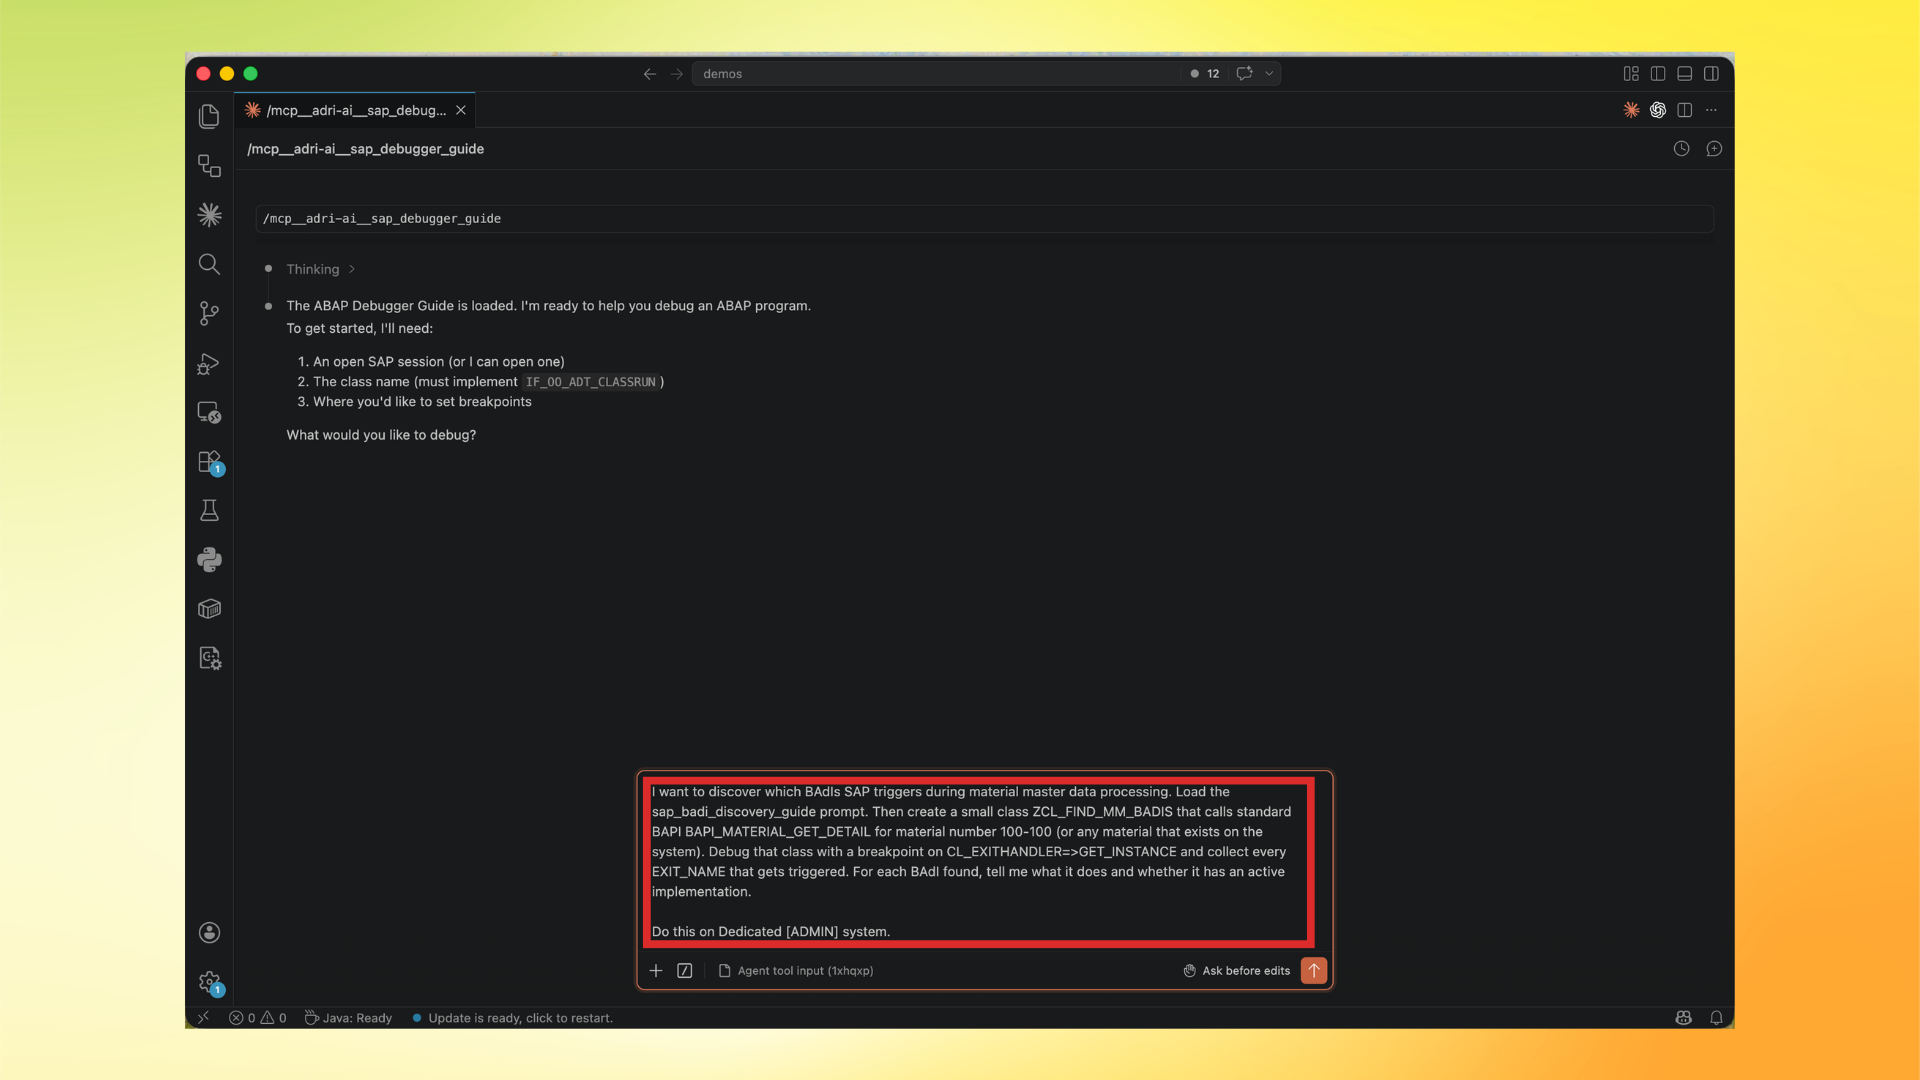
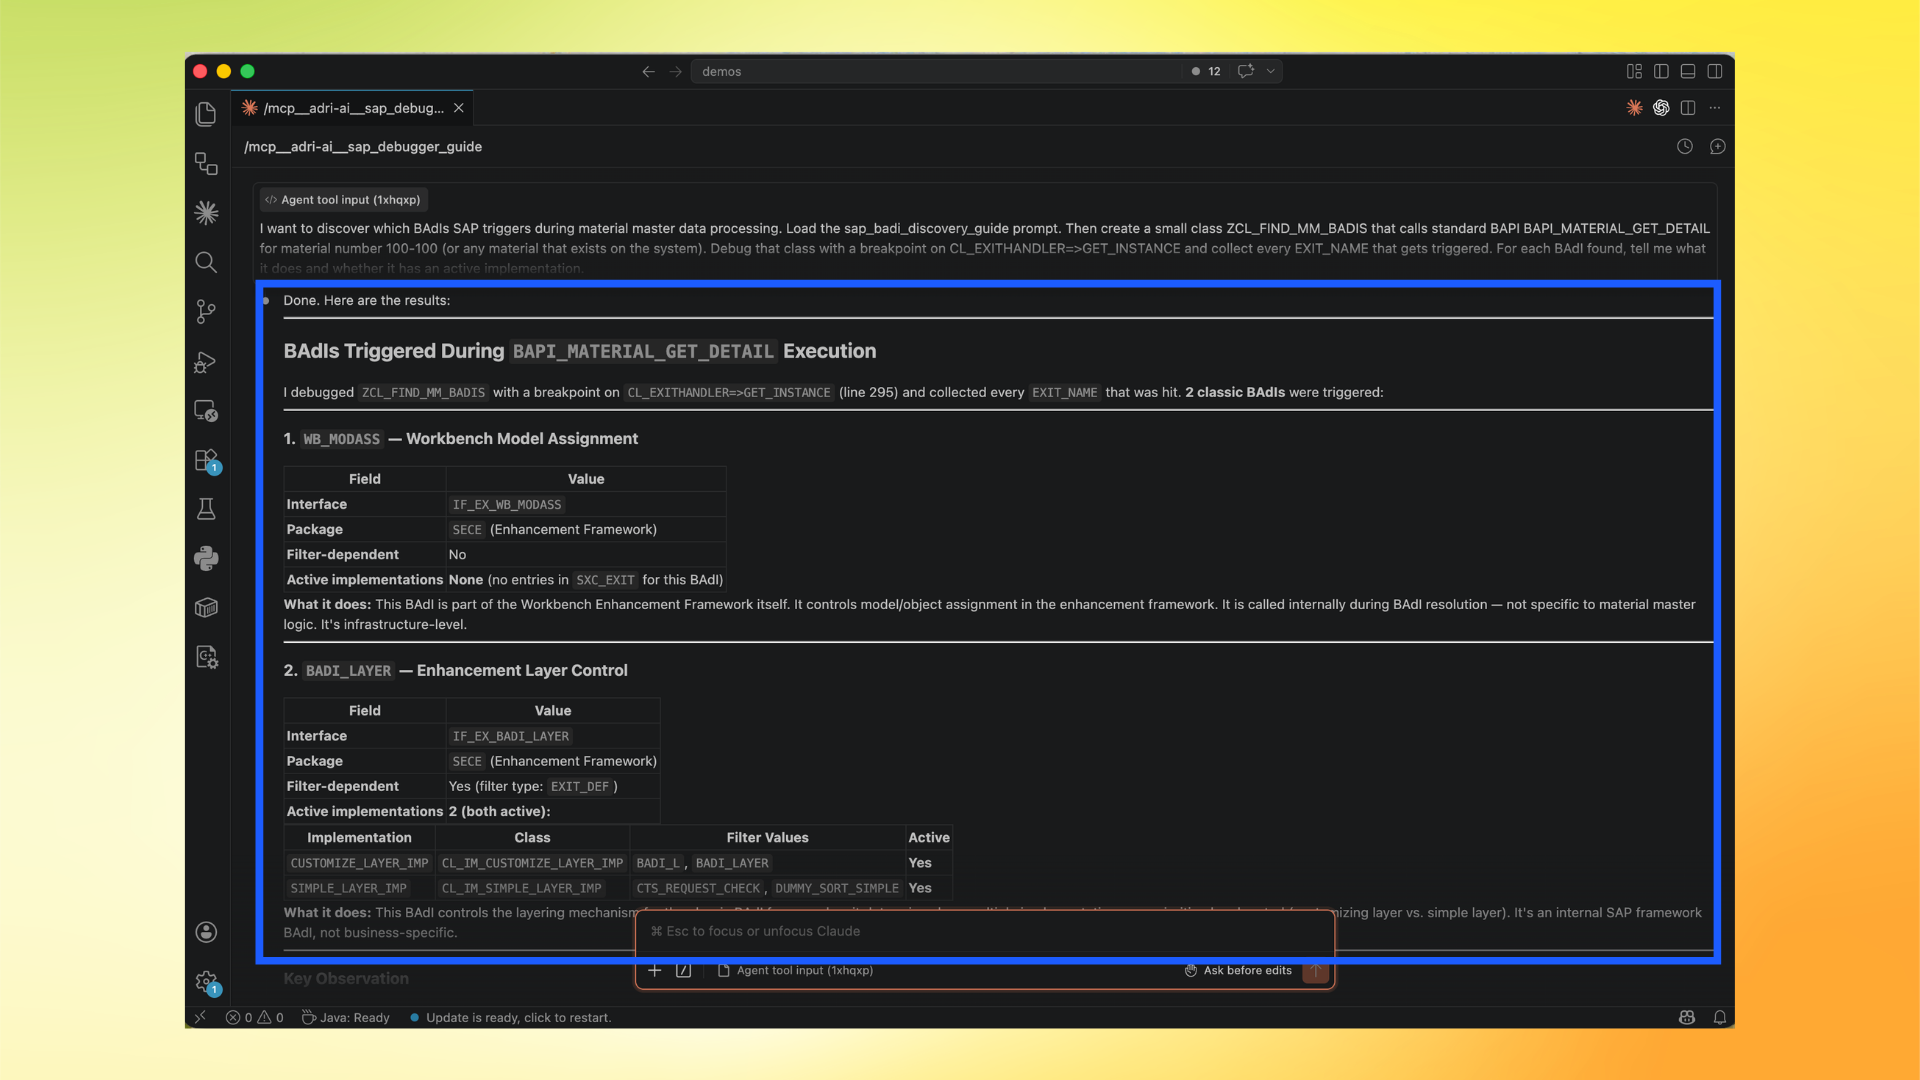
- Ask your debug objective and include where you want the breakpoint.
- When prompted, allow debugger launch (recommended: allow for all projects).
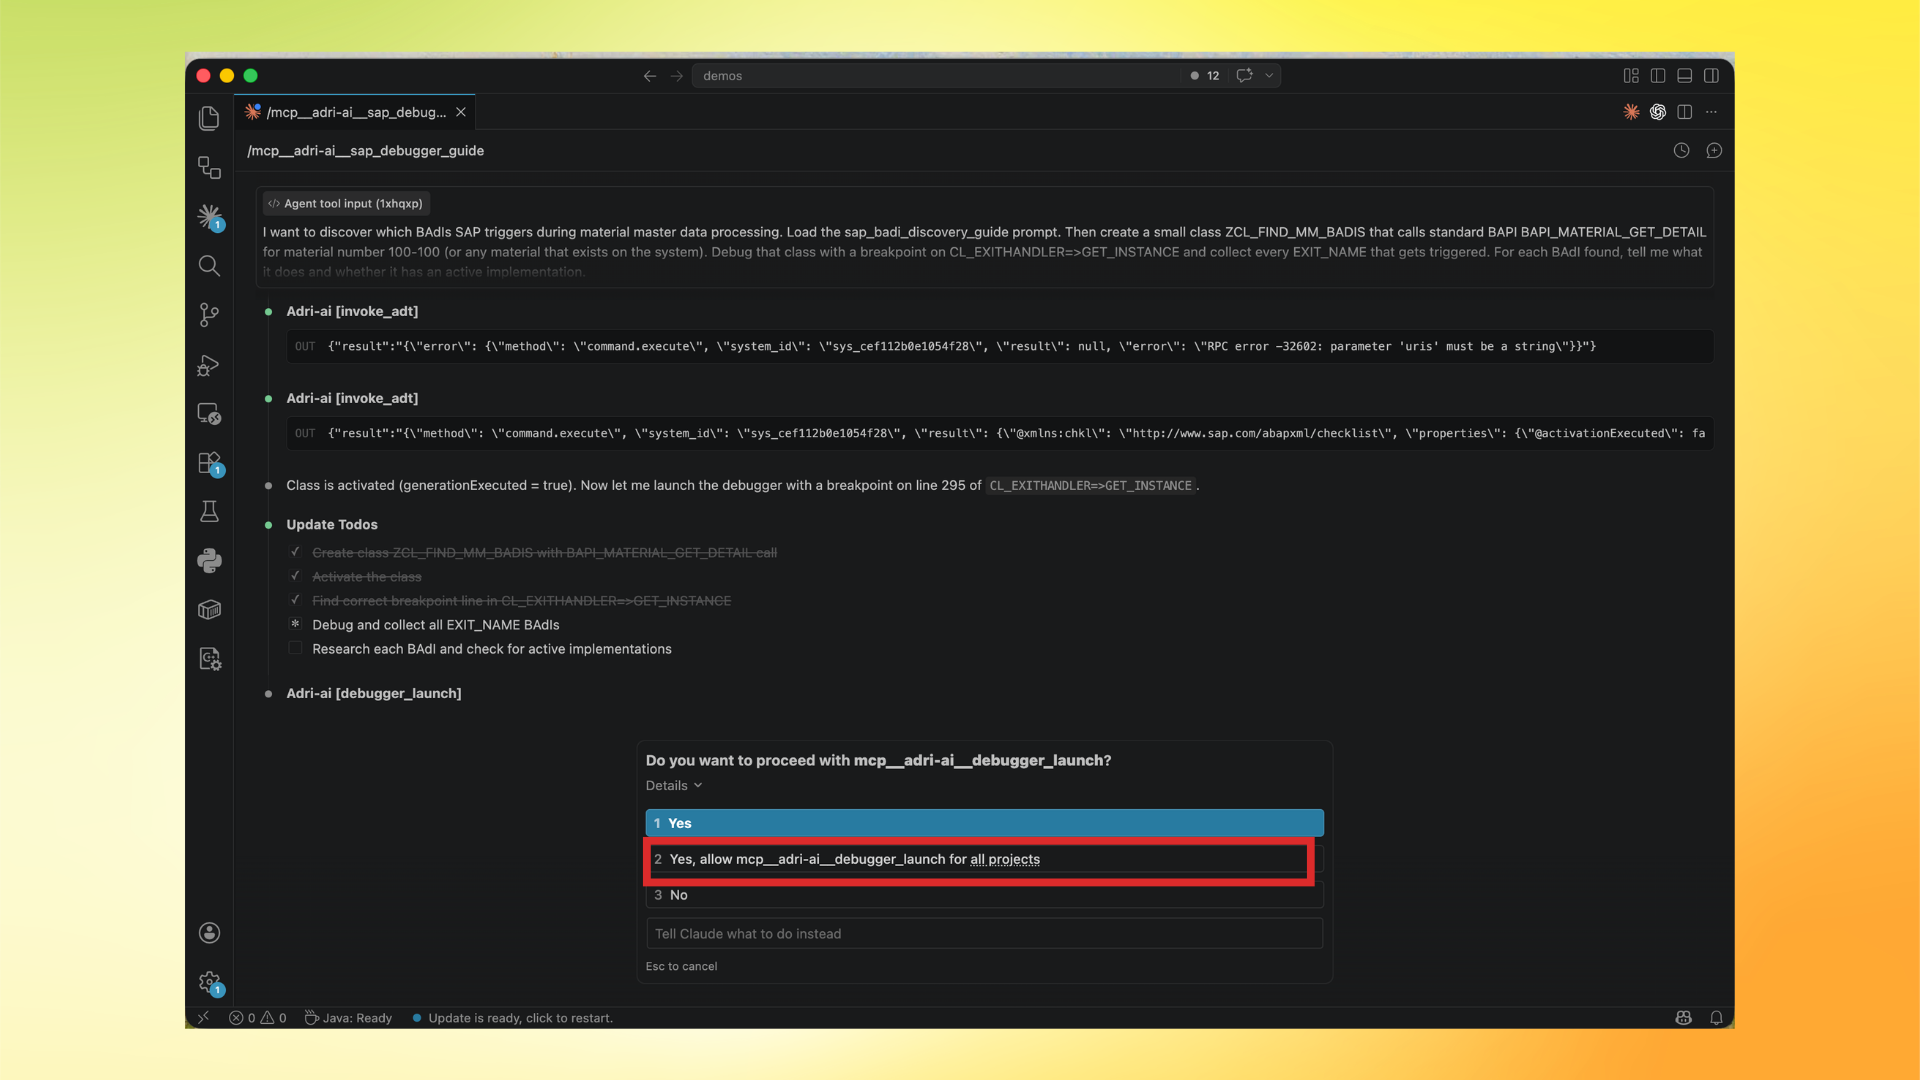
- Review runtime results captured by the agent from debugger execution.
Full Debugger Capability Matrix
All debugger capabilities are now available and working. There are no known debugger limitations at this time.
Launch and lifecycle
| Capability | What it does | Usage | Status |
|---|---|---|---|
debugger_launch | One-step bootstrap: sync breakpoints -> listen -> execute -> attach -> inspect | debugger_launch(session_handle, class_name, breakpoints=[{uri, line, condition?}]) | Working |
debugger.listen | Wait for debuggee sessions | invoke_adt(method="debugger.listen", params={session_id, terminal_id, ide_id, poll_timeout_ms?}) | Working |
debugger.attach | Attach to paused debuggee session | invoke_adt(method="debugger.attach", params={session_id, debuggee_id}) | Working |
debugger.terminate | Terminate or detach debuggee session | invoke_adt(method="debugger.terminate", params={debuggee_session_id?, terminate_debuggee: true/false}) | Working |
Execution control
| Capability | What it does | Usage | Status |
|---|---|---|---|
debugger.step_over | Step over current statement (F6) | invoke_adt(method="debugger.step_over", params={debuggee_session_id}) | Working |
debugger.step_into | Step into current statement (F5) | invoke_adt(method="debugger.step_into", params={debuggee_session_id}) | Working |
debugger.step_return | Step out of current method (F7) | invoke_adt(method="debugger.step_return", params={debuggee_session_id}) | Working |
debugger.continue | Continue until next breakpoint (F8) | invoke_adt(method="debugger.continue", params={debuggee_session_id}) | Working |
debugger.run_to_line | Run to a specific line | invoke_adt(method="debugger.run_to_line", params={debuggee_session_id, source_uri, line}) | Working |
debugger.jump_to_line | Jump execution pointer to a specific line | invoke_adt(method="debugger.jump_to_line", params={debuggee_session_id, source_uri, line}) | Working |
Variable inspection
| Capability | What it does | Usage | Status |
|---|---|---|---|
debugger.get_variables | Get variables at current stop point (@ROOT, @LOCALS, @PARAMETERS, @GLOBALS, @SYSTEM) | invoke_adt(method="debugger.get_variables", params={debuggee_session_id}) | Working |
debugger.get_variables_by_ids | Fetch specific variables by reference IDs | invoke_adt(method="debugger.get_variables_by_ids", params={debuggee_session_id?, variable_ids: ["ME", "@SYSTEM"]}) | Working |
debugger.add_watch_variable | Add watch expression (for example SY-SUBRC, structure fields) | invoke_adt(method="debugger.add_watch_variable", params={debuggee_session_id, expression: "SY-SUBRC"}) | Working |
debugger.get_variable_value | Get full value of a specific variable | invoke_adt(method="debugger.get_variable_value", params={debuggee_session_id?, variable_id, max_length?, hex_format?}) | Working |
debugger.set_variable_value | Modify variable value at runtime | invoke_adt(method="debugger.set_variable_value", params={debuggee_session_id?, variable_id, new_value}) | Working |
debugger.evaluate_expression | Evaluate expression in debug context | invoke_adt(method="debugger.evaluate_expression", params={debuggee_session_id?, expression, max_string_length?, max_nesting_level?}) | Working |
debugger.get_call_stack | Get call stack and frames | invoke_adt(method="debugger.get_call_stack", params={debuggee_session_id}) | Working |
Breakpoint management
| Capability | What it does | Usage | Status |
|---|---|---|---|
debugger.sync_breakpoints | Sync line breakpoints (full/partial mode) | invoke_adt(method="debugger.sync_breakpoints", params={session_id, breakpoints: [{source_uri, line, enabled, client_id?}], mode?: "full"}) | Working |
debugger.sync_statement_breakpoints | Sync statement breakpoints (GET BADI, CALL BADI, COMMIT WORK, etc.) | invoke_adt(method="debugger.sync_statement_breakpoints", params={session_id, statements: ["GET BADI", "CALL BADI"]}) | Working |
debugger.sync_exception_breakpoints | Sync exception breakpoints by class | invoke_adt(method="debugger.sync_exception_breakpoints", params={session_id, exception_classes: ["CX_SY_ZERODIVIDE"]}) | Working |
debugger.set_breakpoint | Set one line breakpoint during active session | invoke_adt(method="debugger.set_breakpoint", params={session_id, source_uri, line}) | Working |
debugger.remove_breakpoint | Remove breakpoint by server ID | invoke_adt(method="debugger.remove_breakpoint", params={session_id, server_id}) | Working |
debugger.validate_condition | Validate breakpoint condition expression | invoke_adt(method="debugger.validate_condition", params={session_id, condition}) | Working |
Watchpoints
| Capability | What it does | Usage | Status |
|---|---|---|---|
debugger.create_watchpoint | Create watchpoint and break on variable change | invoke_adt(method="debugger.create_watchpoint", params={debuggee_session_id?, variable_name, condition?}) | Working |
debugger.delete_watchpoint | Delete a watchpoint | invoke_adt(method="debugger.delete_watchpoint", params={debuggee_session_id?, watchpoint_uri}) | Working |
Multi-session support
- Multiple debugger sessions can run concurrently on the same SAP connection.
- Use
debuggee_session_idfor all post-attach calls so each action targets the correct session. - Existing calls without
debuggee_session_idcontinue to work through backward-compatible fallback behavior.
Summary
26debugger RPC methods are fully wired and working.- Plus
1composite debugger tool and1debugger guide prompt are available. - No known debugger limitations at this time.