ABAP Debugger
The Adri AI Foundry for VS Code extension includes an integrated ABAP debugger that runs inside VS Code against your connected SAP system. You get the standard debugger surface — variables, call stack, breakpoints, and stepping — without leaving the editor.
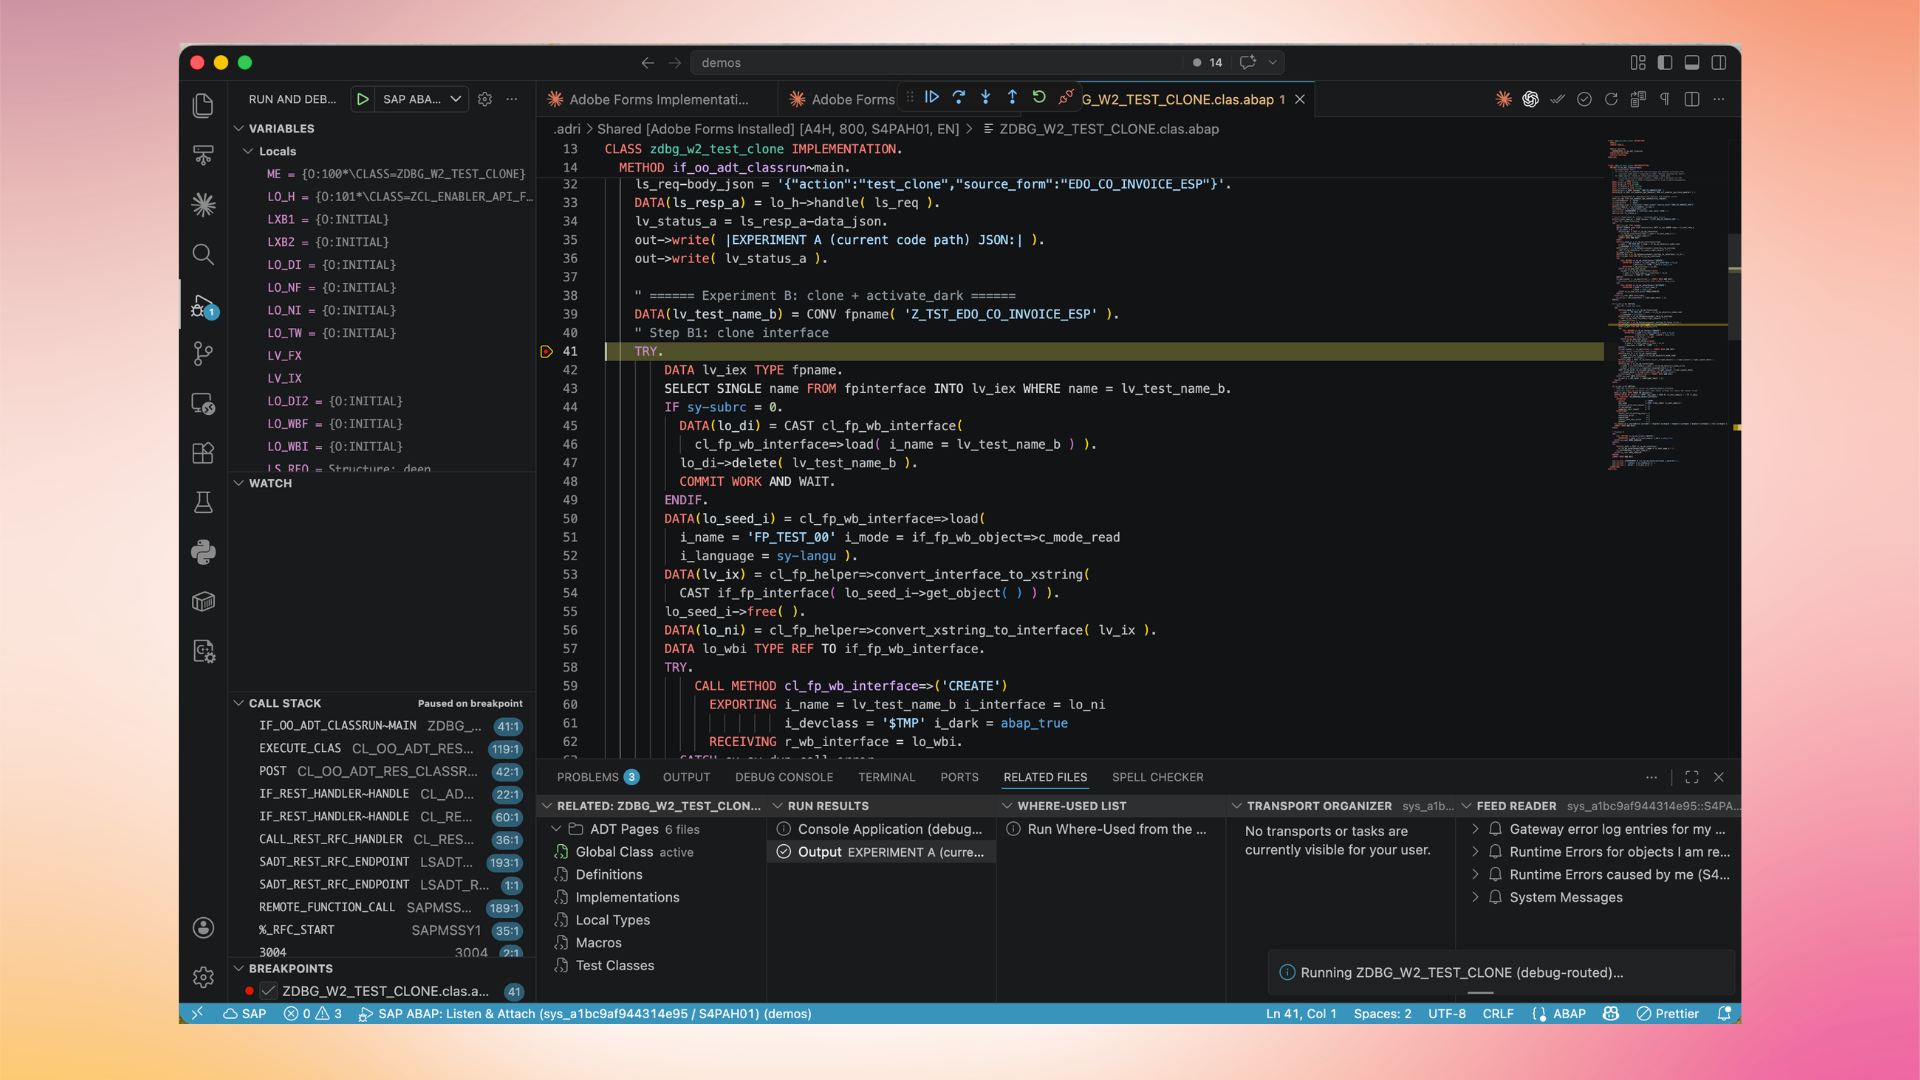
The debugger window shows:
- Variables — local and global variables with their current values.
- Call Stack — the active call hierarchy in the running ABAP session.
- Source view — the ABAP source code with the current execution line highlighted.
- Bottom panels — ADT messages, application logs, transport organizer, related links, and task lists.
To launch a debugger session, set a breakpoint in the source view of an open ABAP object, then trigger execution from the connected system. The Adri AI Foundry extension attaches the debugger to the running process automatically.
For agent-driven debugging (where Claude Code or Codex drives the debugger via MCP), see MCP capabilities.