Use Debugger to Find BAdI Automatically
Why this use case matters
Finding the right BAdI in SAP can be slow when done manually. With Adri AI debugger capability, you can trace actual runtime flow and identify triggered BAdIs automatically.
This is useful when you need to know:
- which
EXIT_NAMEvalues are actually hit - whether matching implementations are active
- what each discovered BAdI is responsible for
Pre-requisites
- Complete MCP setup in Claude Code: Setup (Claude Code)
- Make sure your SAP system is connected and reachable.
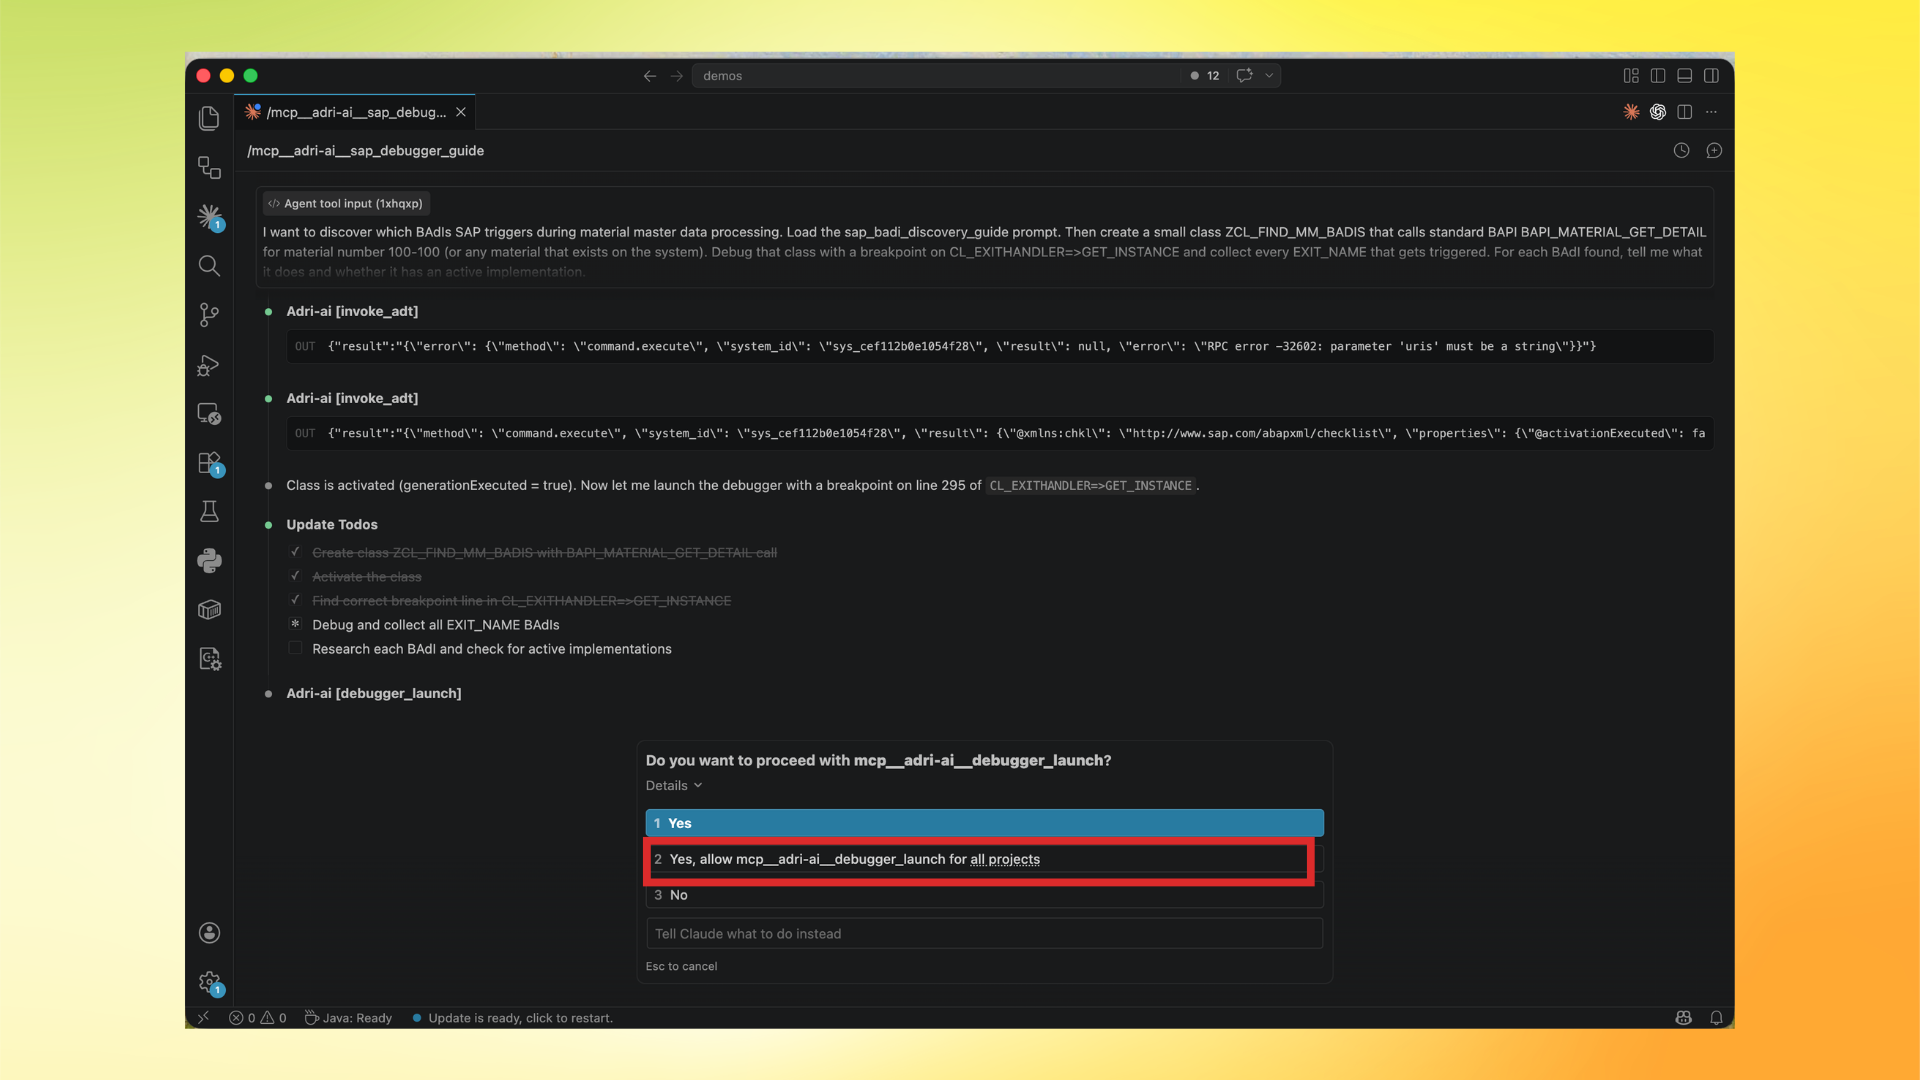
In these screenshots, the red box shows user action and the blue box shows important information to note.
Step-by-step in Claude Code
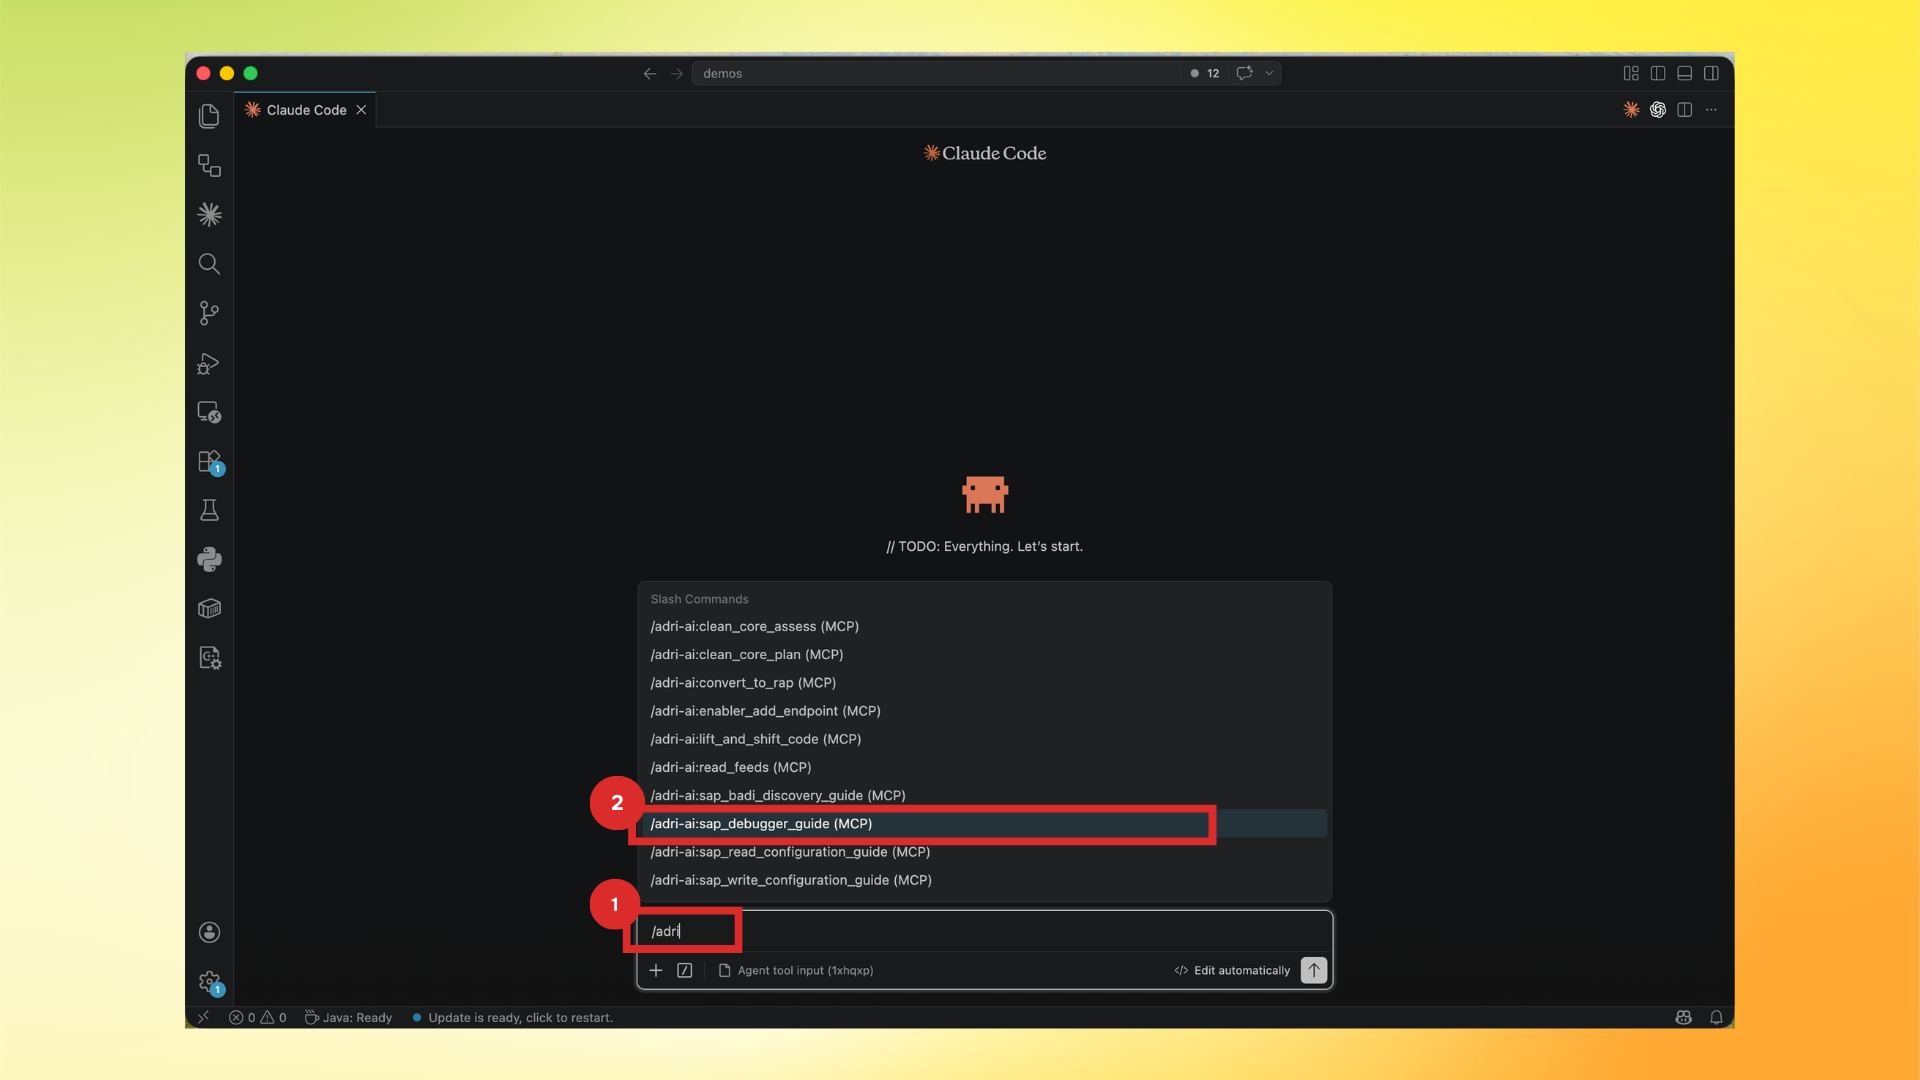
- Type
/adriand select/adri-ai:sap_debugger_guide (MCP).
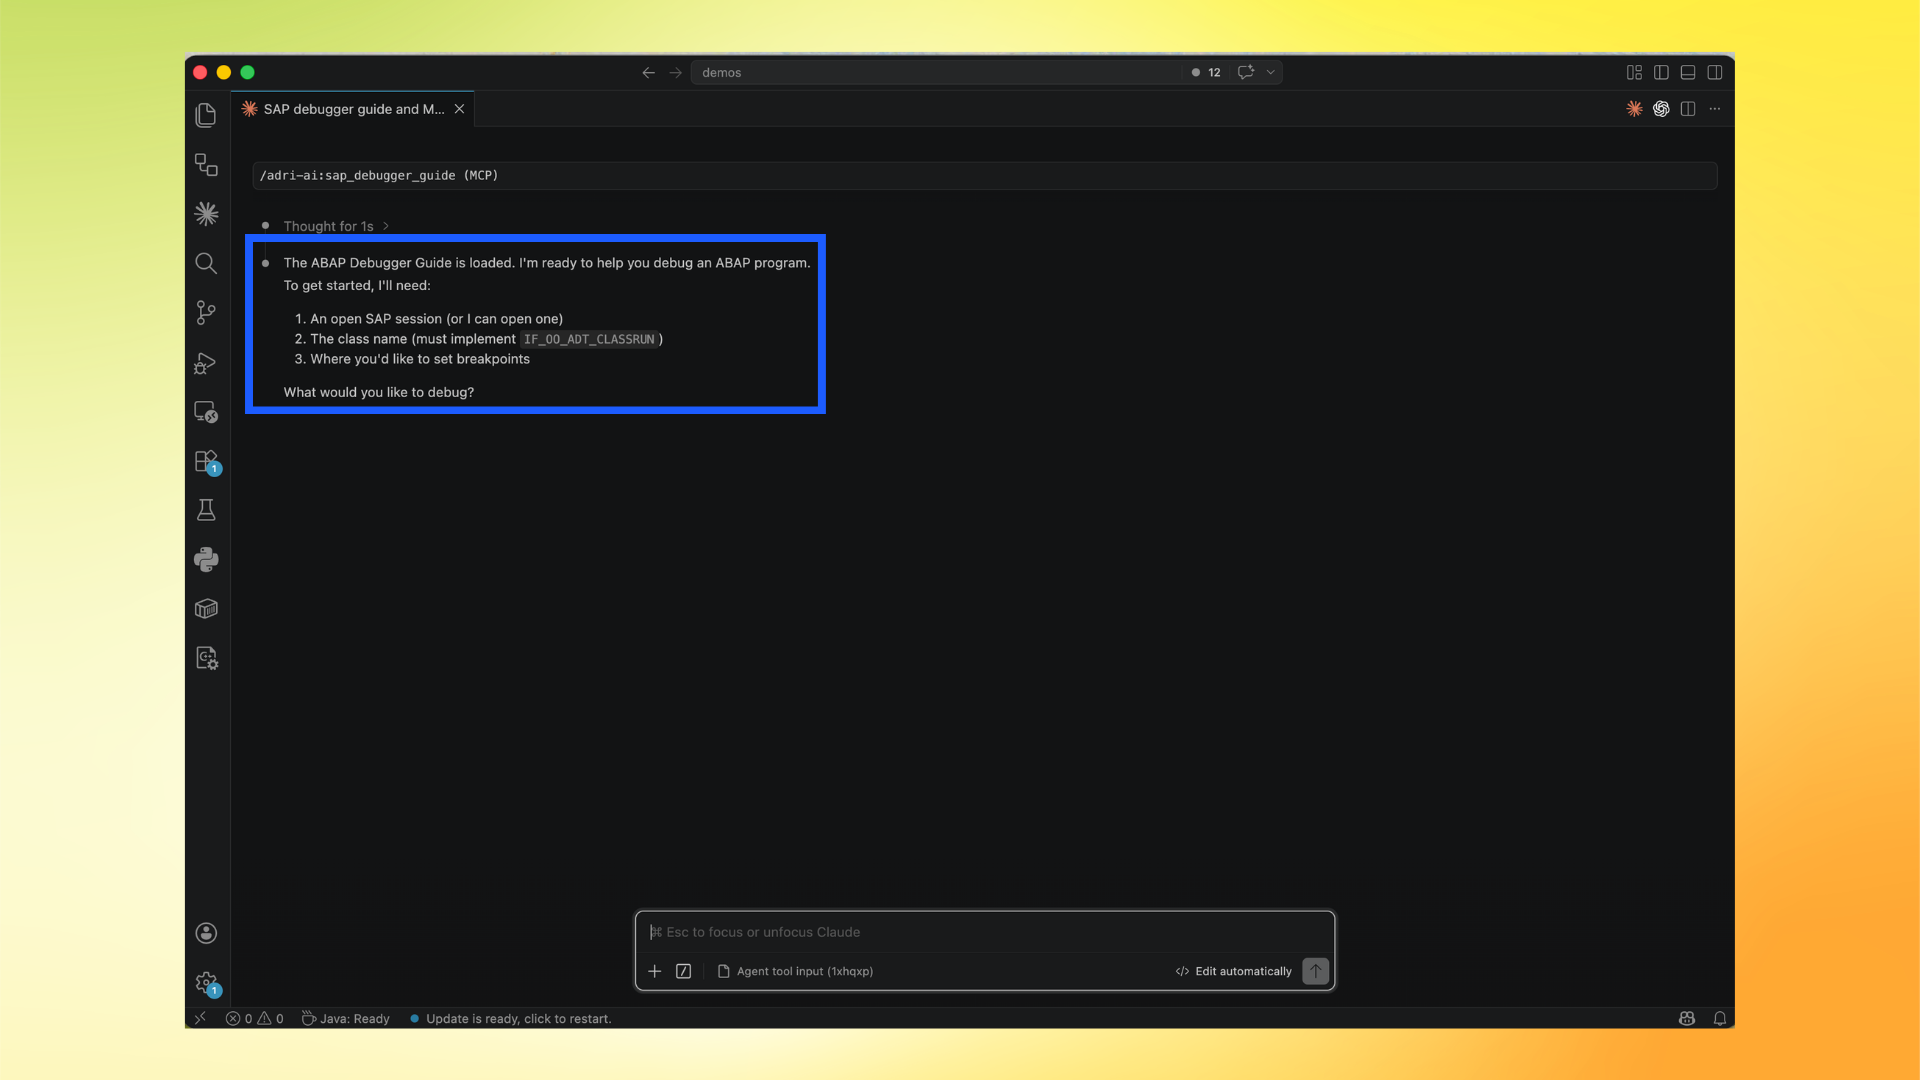
- Confirm the debugger guide is loaded and read the required inputs.
- Ask Adri AI to run a BAdI-focused debugger flow.
Example prompt:
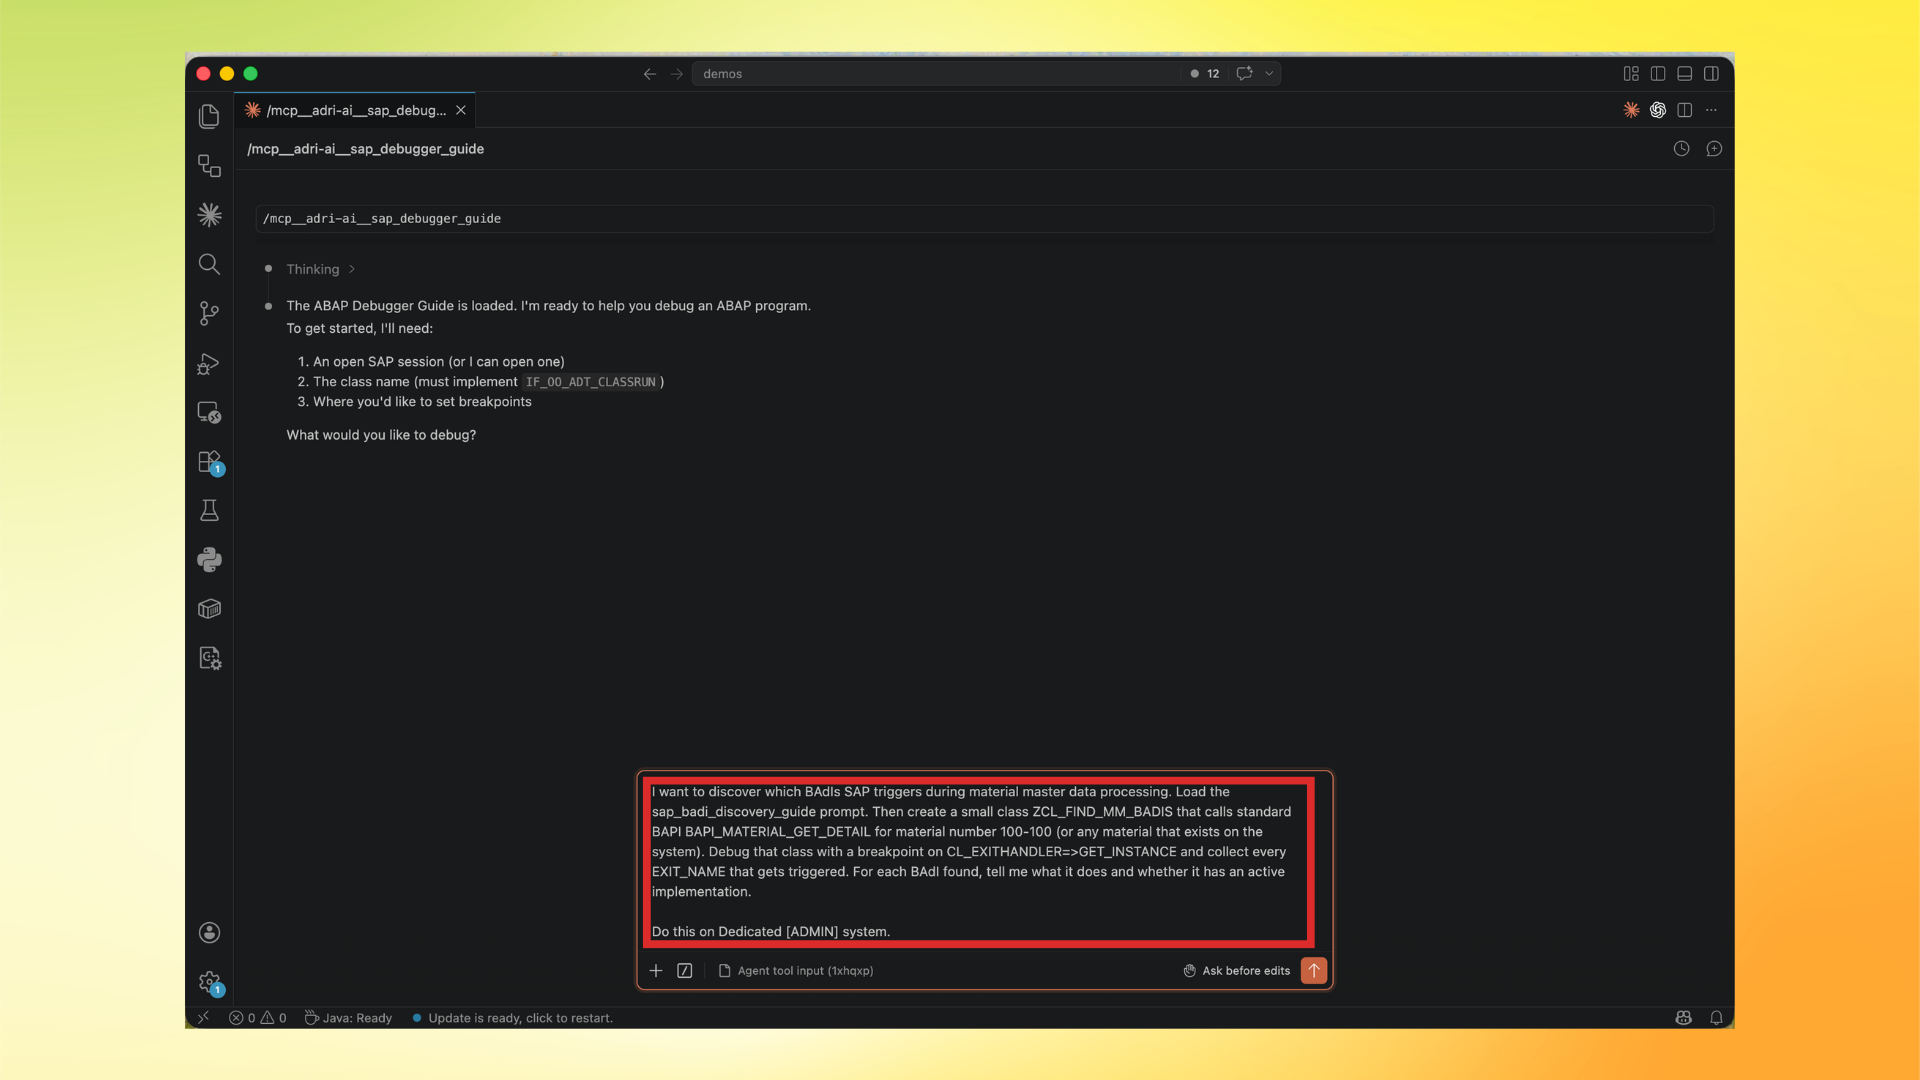
I want to discover which BAdIs SAP triggers during material master data processing.
Load the sap_badi_discovery_guide prompt. Then create a small class ZCL_FIND_MM_BADIS that calls standard BAPI BAPI_MATERIAL_GET_DETAIL for material number 100-100 (or any material that exists on the system).
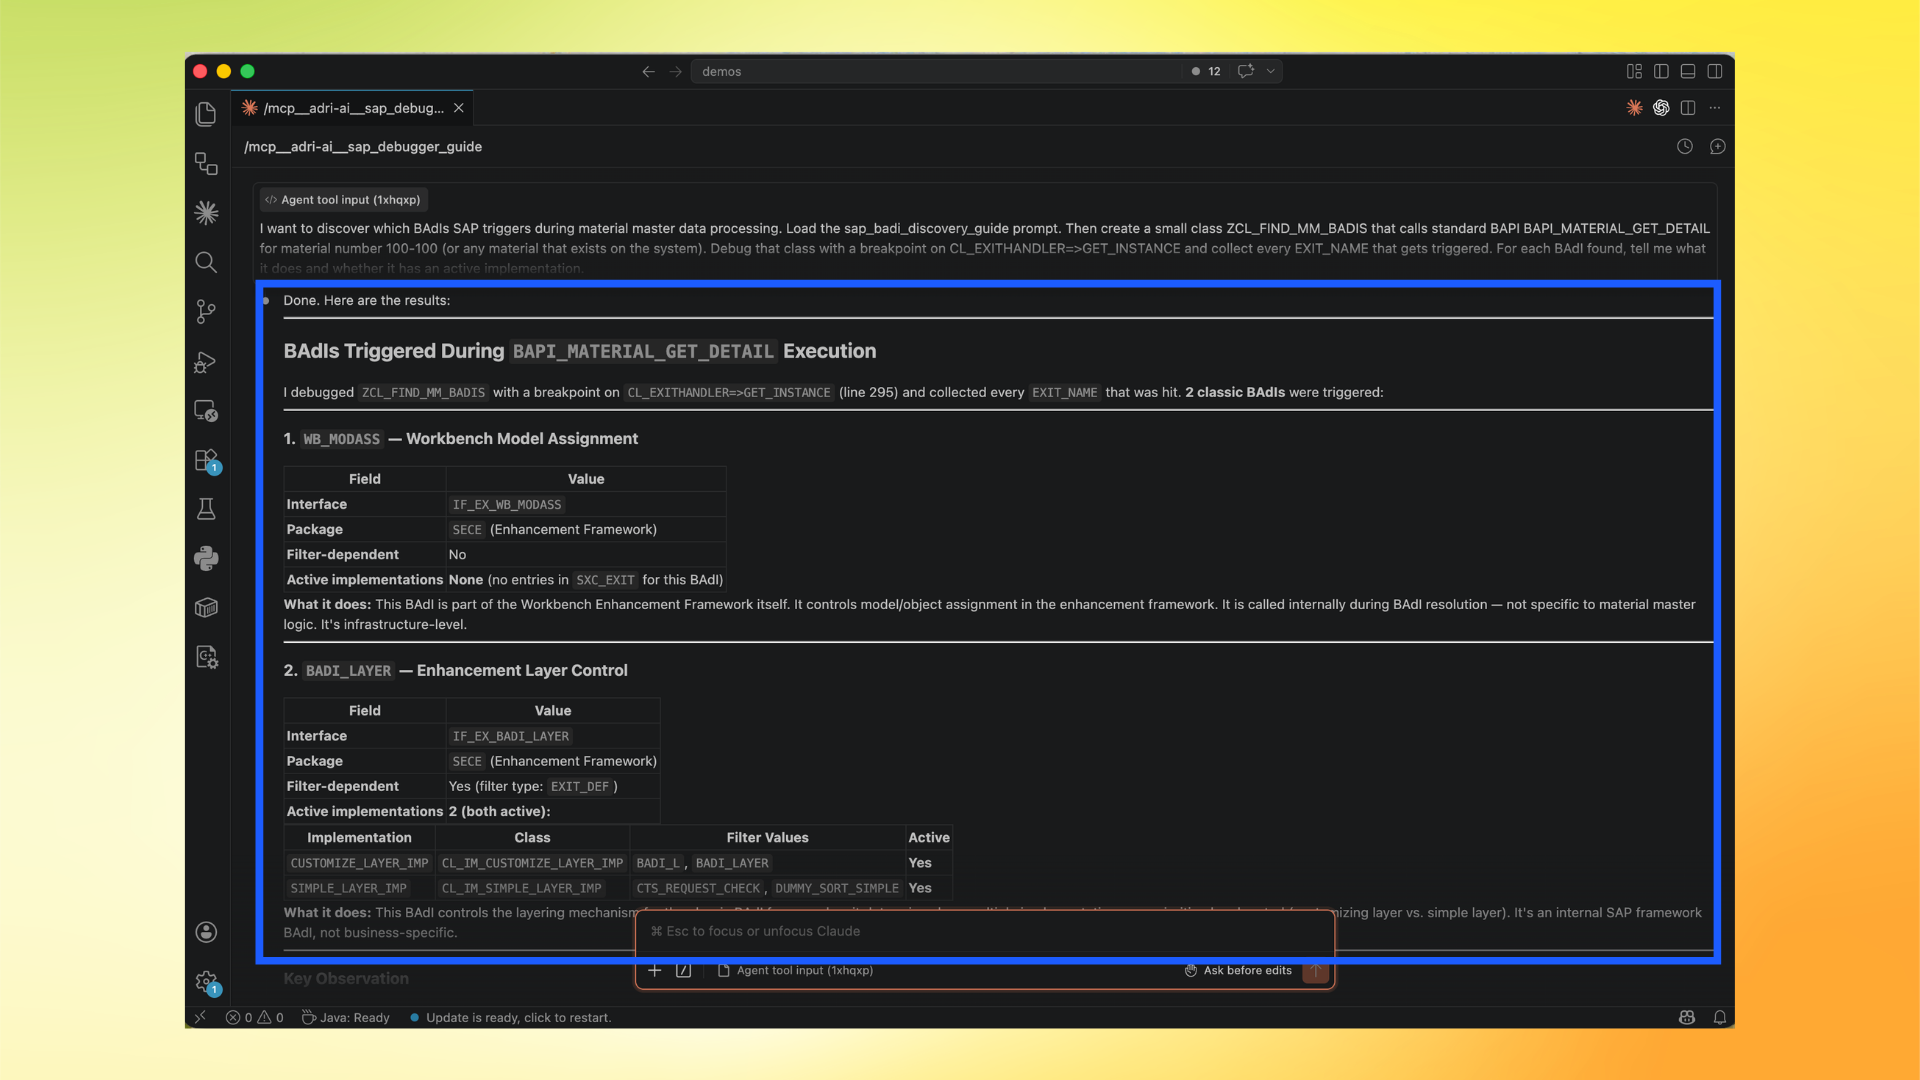
Debug that class with a breakpoint on CL_EXITHANDLER=>GET_INSTANCE and collect every EXIT_NAME that gets triggered.
For each BAdI found, tell me what it does and whether it has an active implementation.
Do this on Dedicated [ADMIN] system.
- When tool permission appears, allow debugger launch (prefer all projects).
- Review the final runtime findings list.